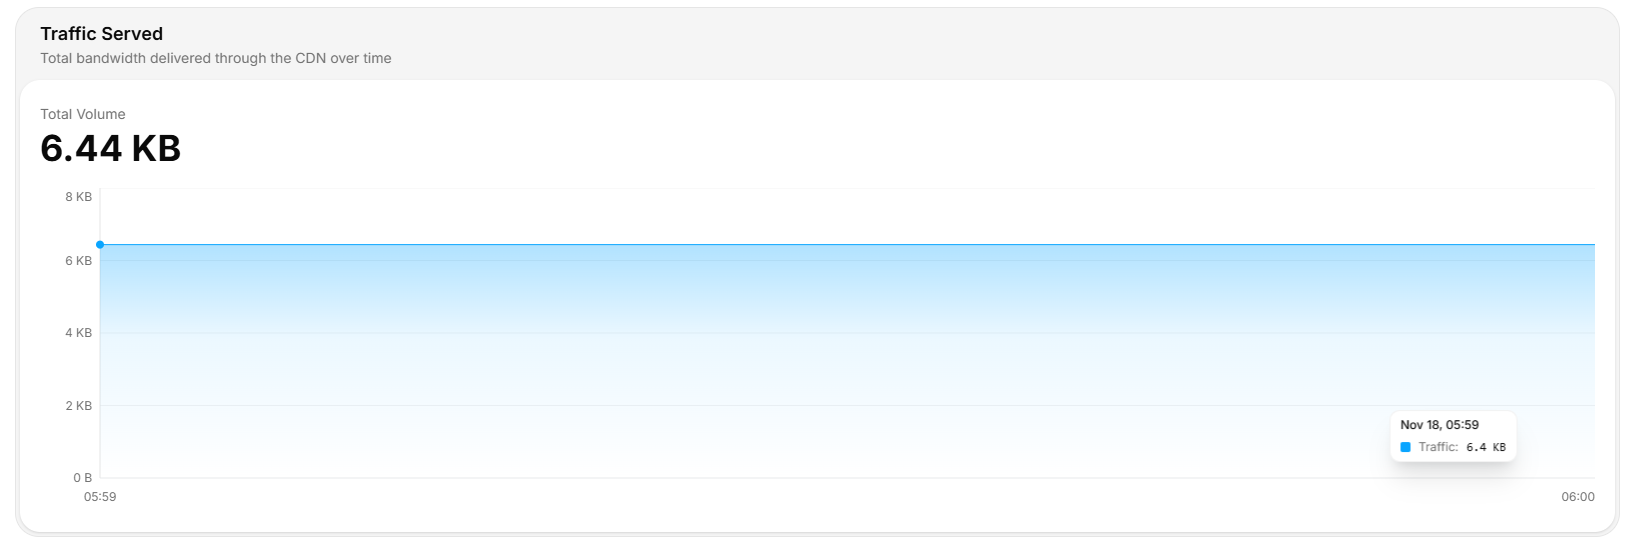
Traffic Served measures the bytes the CDN sent to clients in a given window. It drives your bandwidth bill and signals whether traffic patterns are shifting under you.Documentation Index
Fetch the complete documentation index at: https://docs.tenbyte.io/llms.txt
Use this file to discover all available pages before exploring further.

What it tells you
- Total bytes delivered to end users.
- Period-over-period change (today vs yesterday, week vs week).
- Trend lines that surface launches, viral spikes, and outages.
How to read the chart
| Element | Meaning |
|---|---|
| Main number | Total bytes (KB / MB / GB / TB) for the selected window. |
| Percentage | Change vs the prior identical window. Positive = growth. |
| Sparkline | Distribution over time — find spikes and dips. |
Pull via API
granularity, per-PoP breakdown).
Common patterns
| Pattern | What it usually means |
|---|---|
| Steady daytime peaks | Healthy — track week-over-week ratio. |
| Sudden spike with low cache-hit ratio | Origin will feel it. Check cache hit ratio and rule TTLs. |
| Spike with stable hit ratio | Real traffic growth. Capacity-plan origin. |
| Sustained drop | DNS issue, broken deploy, or upstream redirect bypassing the CDN. |
Cost levers
- Raise cache hit ratio. Higher HIT% = same user-facing bytes, less origin egress.
- Compress text. Enable Gzip / Brotli in cache rules.
- Right-size images. Use Image Optimizer with
format=autoand capped widths. - Cap query-string variants. A noisy cache key duplicates the same bytes.
Operational tips
- Daily totals to finance. Pipe API totals into your billing spreadsheet or BI tool.
- Per-path breakdowns. Use the path filter to find the top 10 bandwidth consumers; cache or compress them harder.
- Alert on rate, not total. A 5× hourly spike is more actionable than absolute totals.