> ## Documentation Index
> Fetch the complete documentation index at: https://docs.tenbyte.io/llms.txt
> Use this file to discover all available pages before exploring further.
# Traffic and Performance Metrics
This dashboard displays how videos are delivered across the network, highlighting usage trends, delivery performance, and caching efficiency over a selected time range.
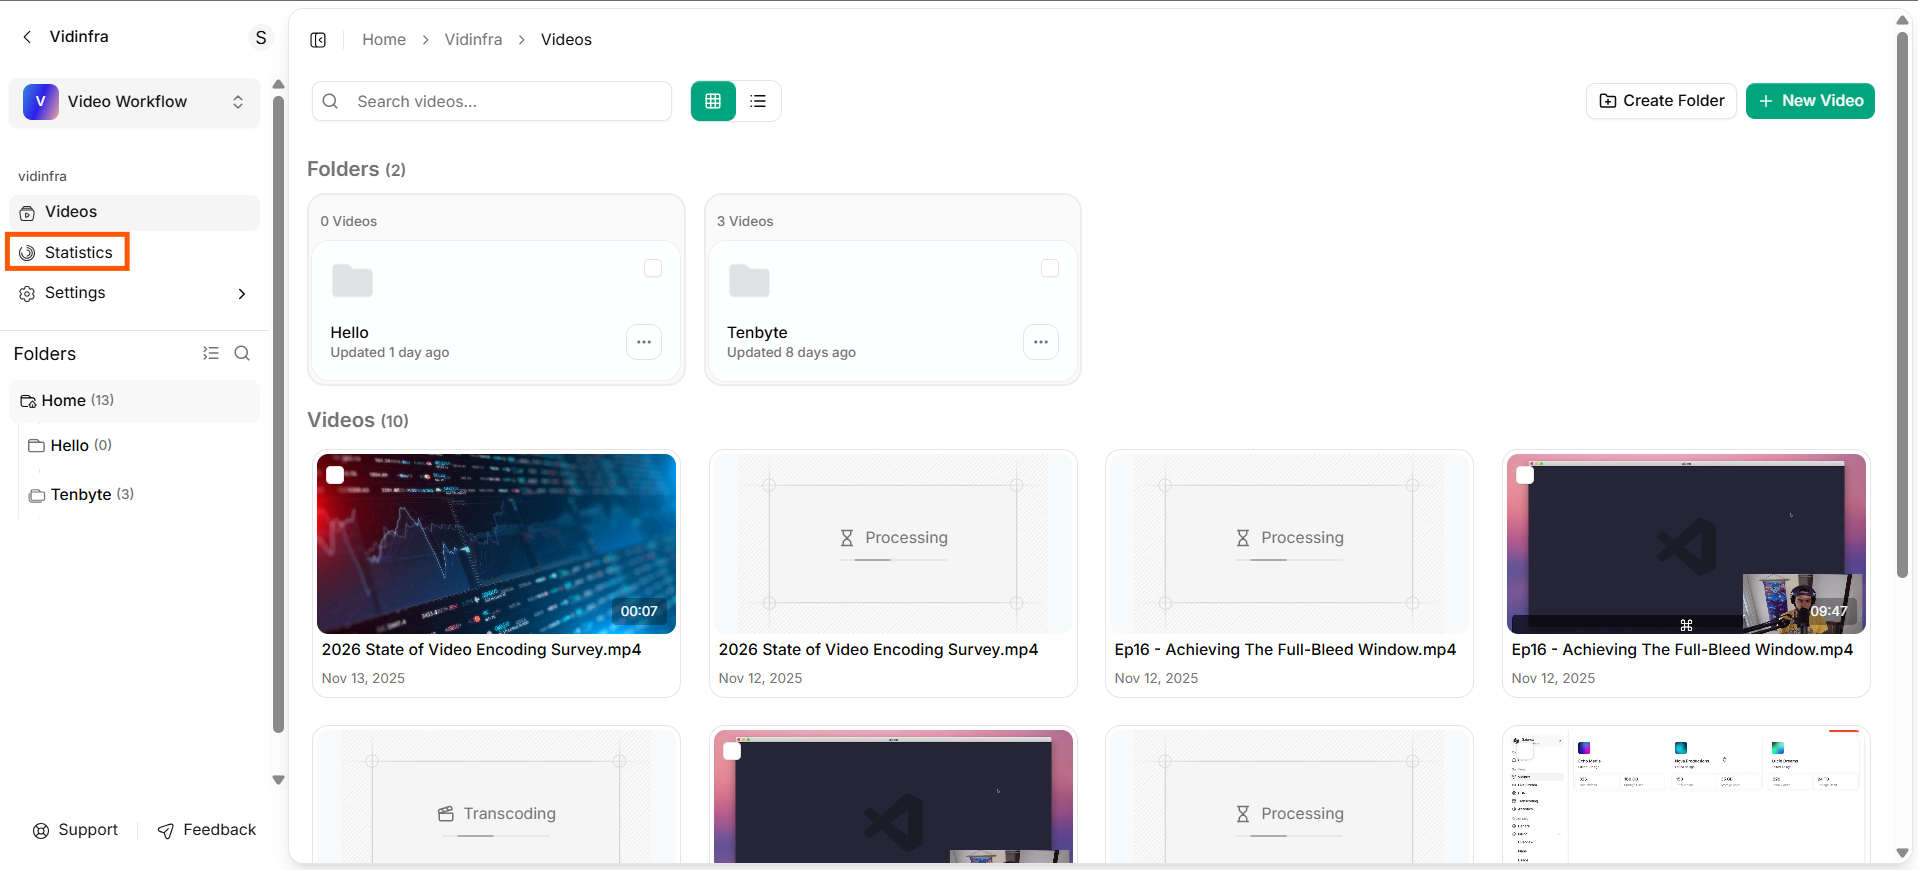
* When you enter your preferred video library, you will see a **Statistics** option in the left sidebar. Select it to open the analytics dashboard for that library and view traffic, requests, and caching performance.
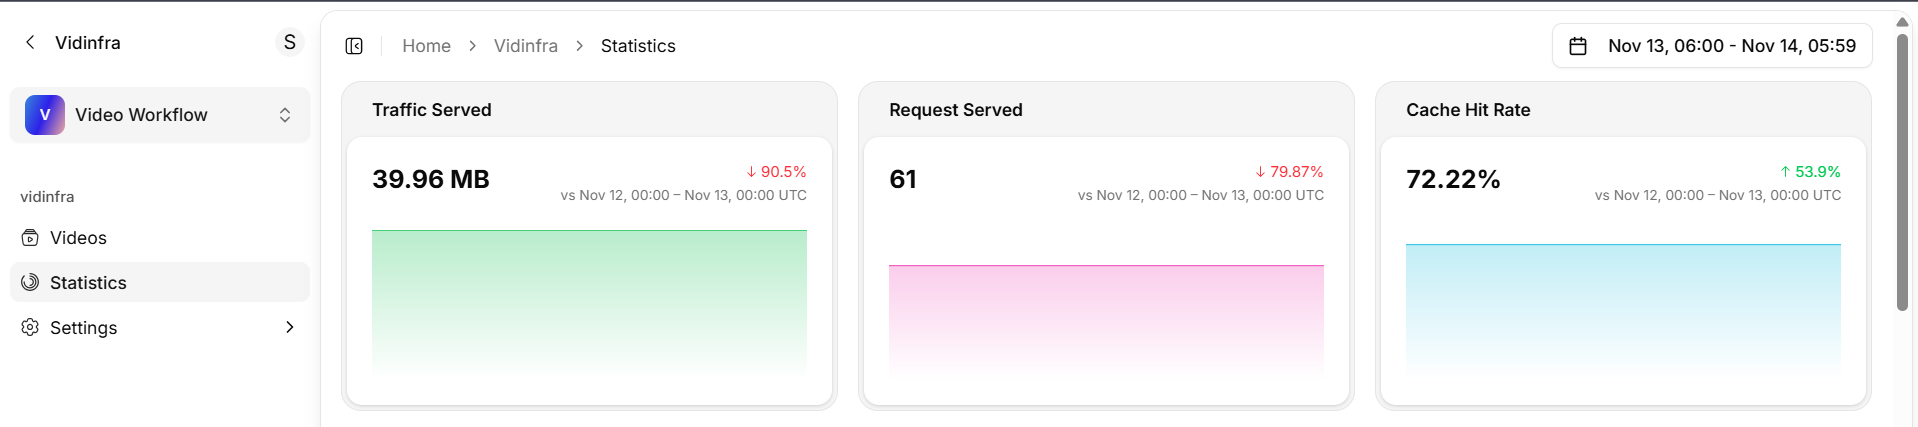
 * At the top of the **Statistics** page, you will see a quick snapshot of your key analytics. This includes **Traffic Served**, **Total Requests**, and **Cache Hit Rate** for the selected time range.
 Scroll down to view the detailed charts and breakdowns for each metric. These sections help you understand usage patterns, delivery quality, and caching performance in depth.
## 1. Traffic Served
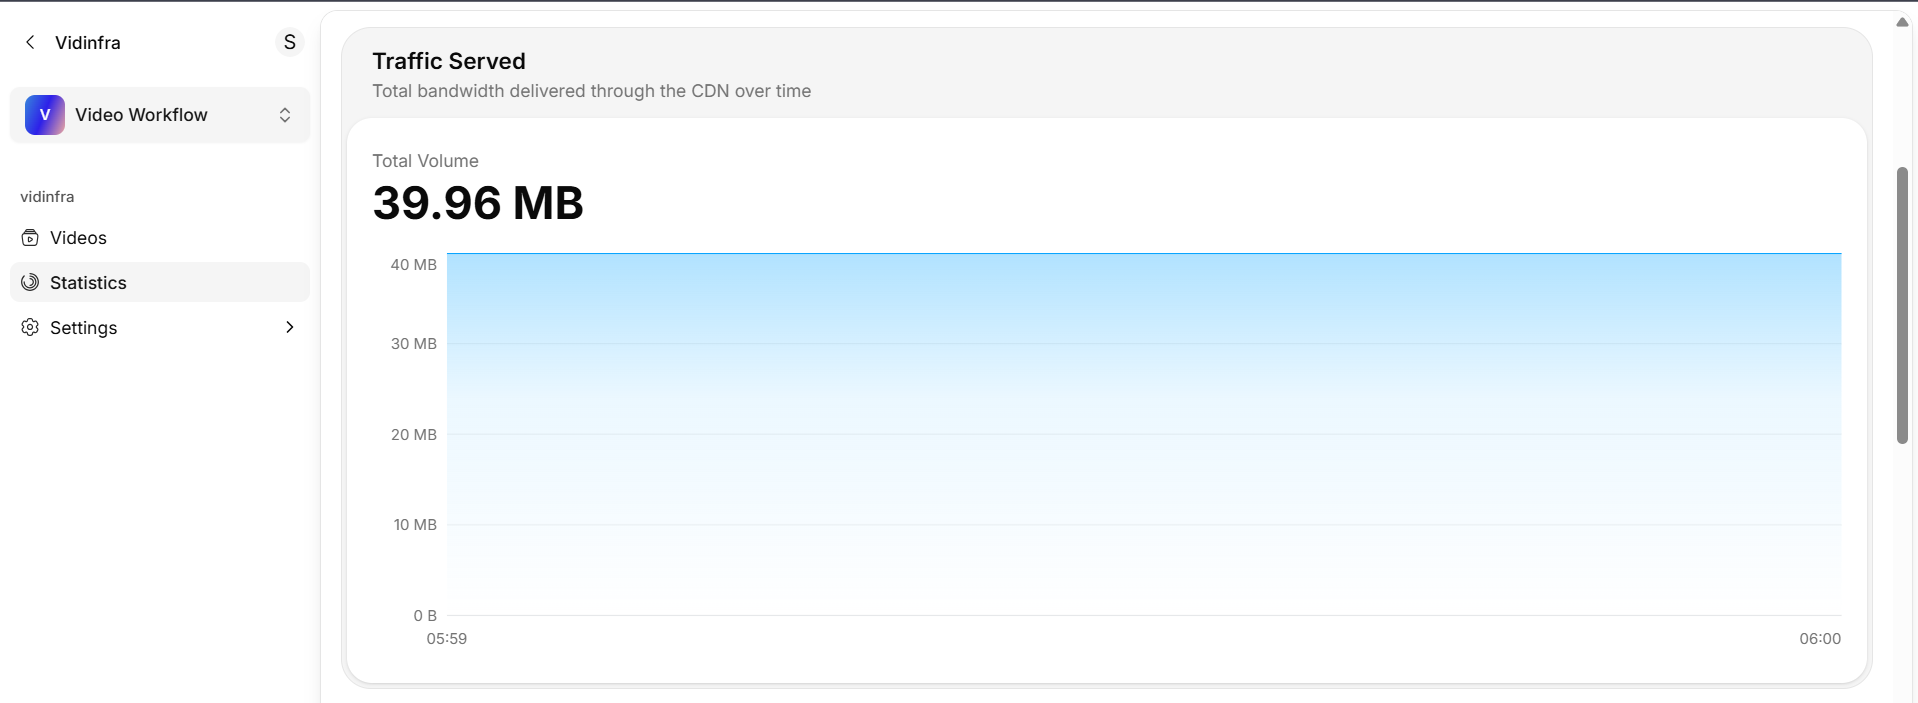
Shows the total data delivered from your video library within the selected period.
Scroll down to view the detailed charts and breakdowns for each metric. These sections help you understand usage patterns, delivery quality, and caching performance in depth.
## 1. Traffic Served
Shows the total data delivered from your video library within the selected period.
 ### What it tells you:
* How much bandwidth your videos consumed.
* Whether usage increased or decreased compared to the previous period.
* How traffic trends shift over time.
### How to read it:
* The main number shows total MB or GB delivered.
* The percentage compares today’s traffic with the previous day.
***
## 2. Requests Served
Shows how many requests were made to fetch your videos.
### What it tells you:
* How much bandwidth your videos consumed.
* Whether usage increased or decreased compared to the previous period.
* How traffic trends shift over time.
### How to read it:
* The main number shows total MB or GB delivered.
* The percentage compares today’s traffic with the previous day.
***
## 2. Requests Served
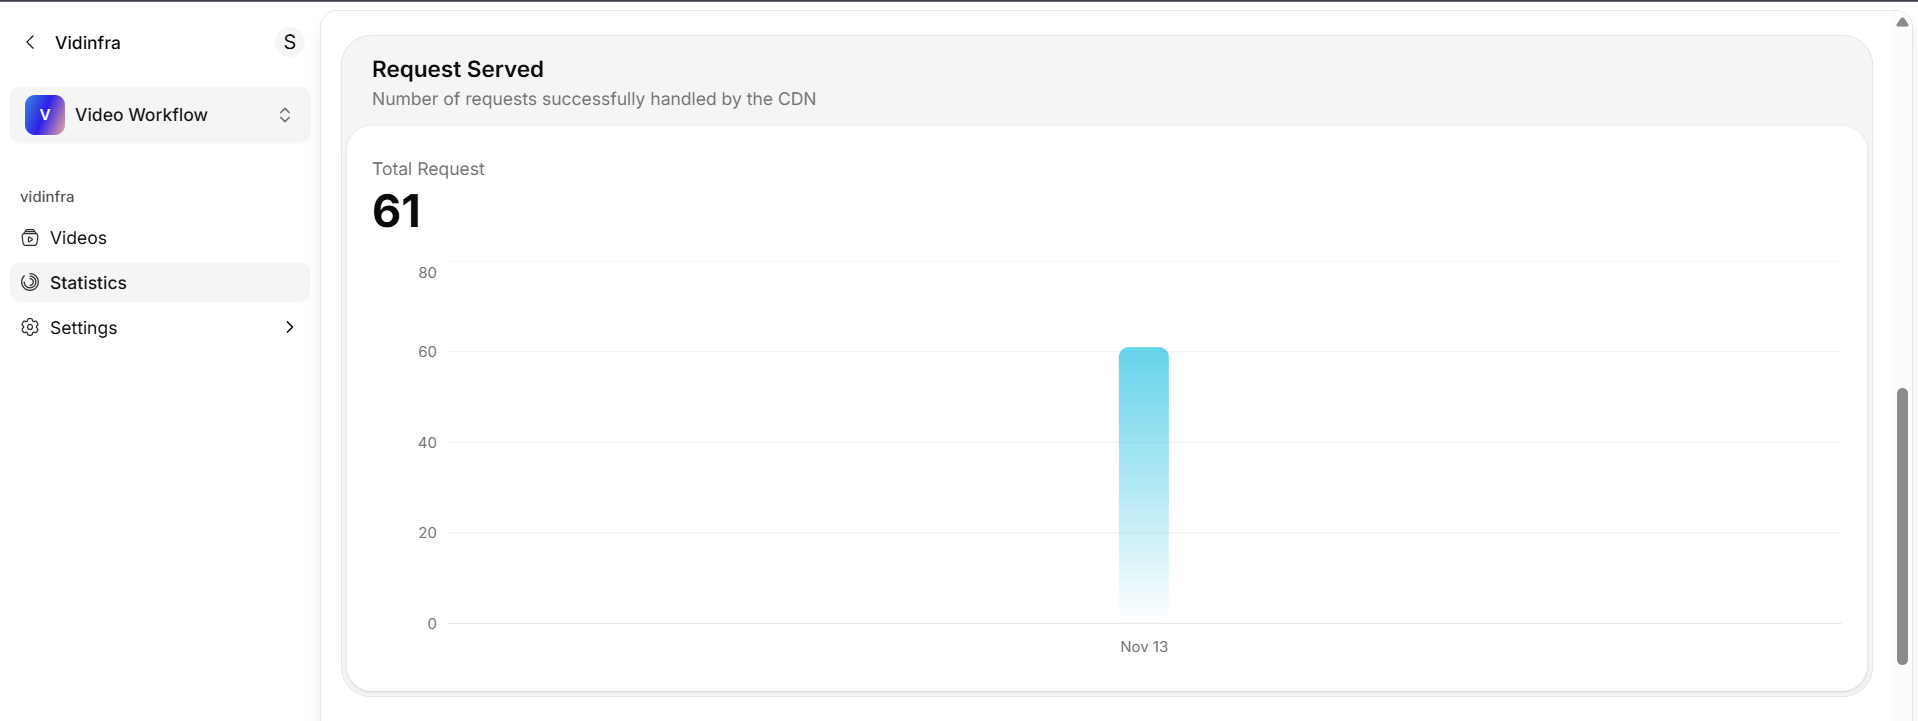
Shows how many requests were made to fetch your videos.
 ### What it tells you:
* The number of video load events from viewers.
* How often content is being accessed.
### How to read it:
* The main number shows total requests.
* The percentage reflects request changes since the last time window.
***
## 3. Cache Hit Rate
Shows how often content was delivered from the cache instead of the origin.
### What it tells you:
* The number of video load events from viewers.
* How often content is being accessed.
### How to read it:
* The main number shows total requests.
* The percentage reflects request changes since the last time window.
***
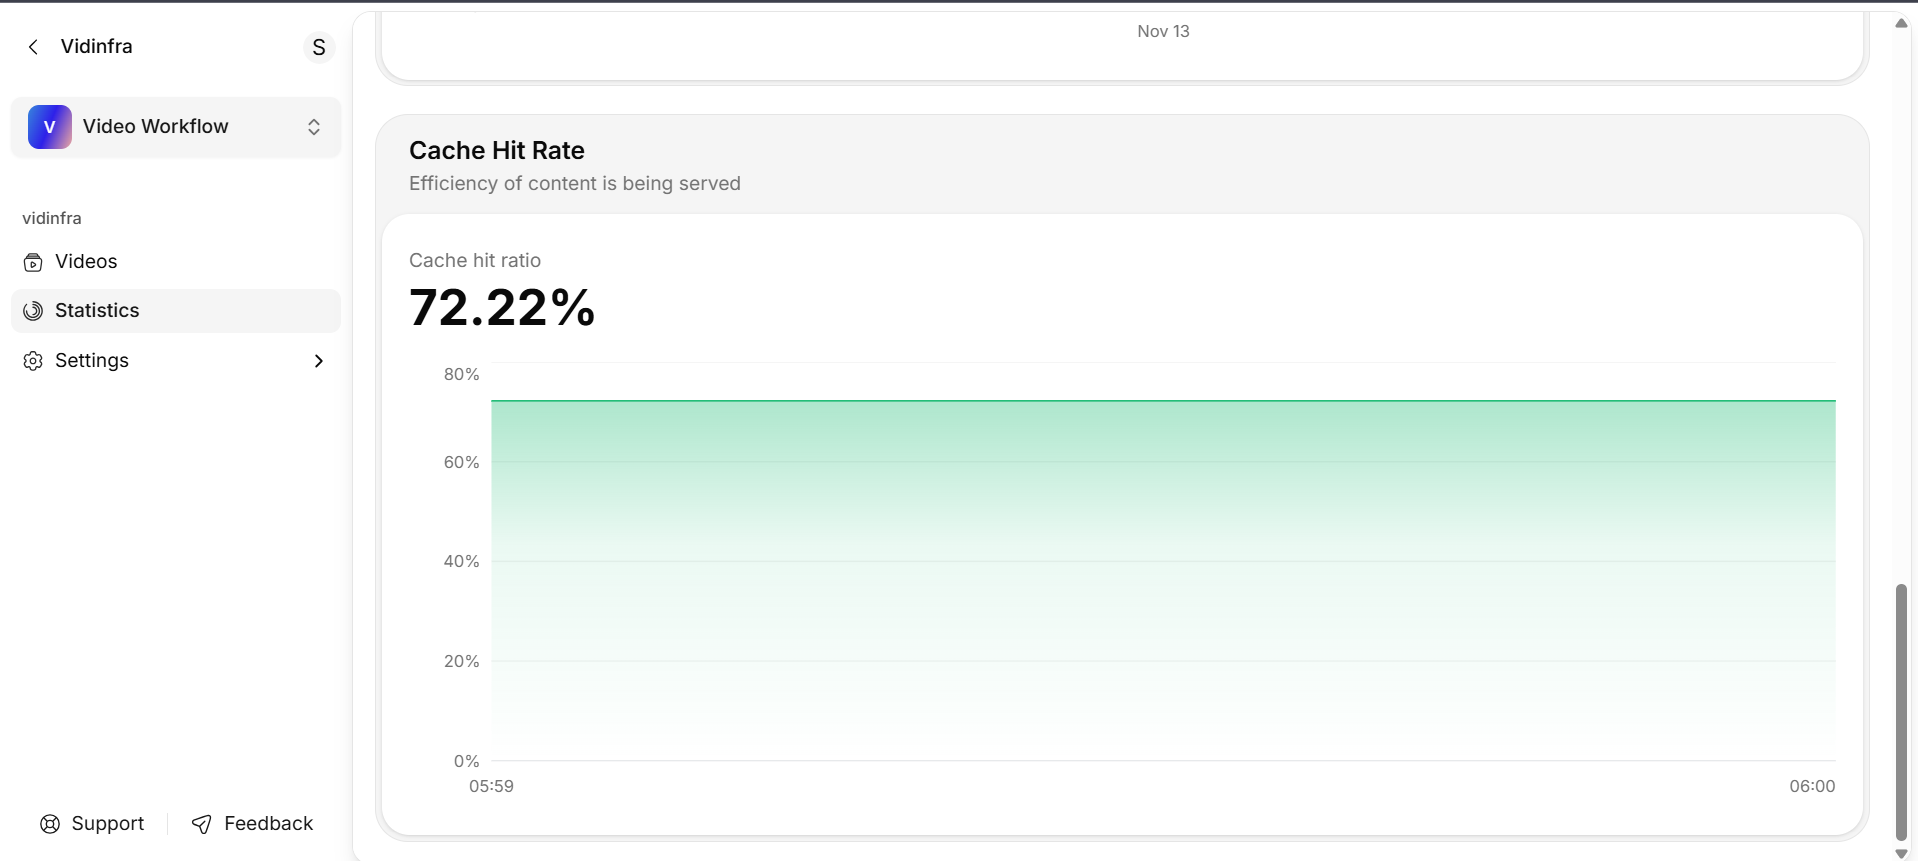
## 3. Cache Hit Rate
Shows how often content was delivered from the cache instead of the origin.
 ### What it tells you:
* How efficiently your content is cached.
* Whether viewers are getting faster response times.
* How much load is reduced on the origin.
### How to read it:
* Higher percentages indicate better caching.
* A higher cache hit rate results in faster playback and lower origin usage.
### What it tells you:
* How efficiently your content is cached.
* Whether viewers are getting faster response times.
* How much load is reduced on the origin.
### How to read it:
* Higher percentages indicate better caching.
* A higher cache hit rate results in faster playback and lower origin usage.