> ## Documentation Index
> Fetch the complete documentation index at: https://docs.tenbyte.io/llms.txt
> Use this file to discover all available pages before exploring further.
# Tenbyte Cloud Metrics
Monitor and analyze the performance of your virtual machines in Tenbyte Cloud using key system metrics like CPU, RAM, Disk I/O, and Network bandwidth.
## Access the Metrics Tab
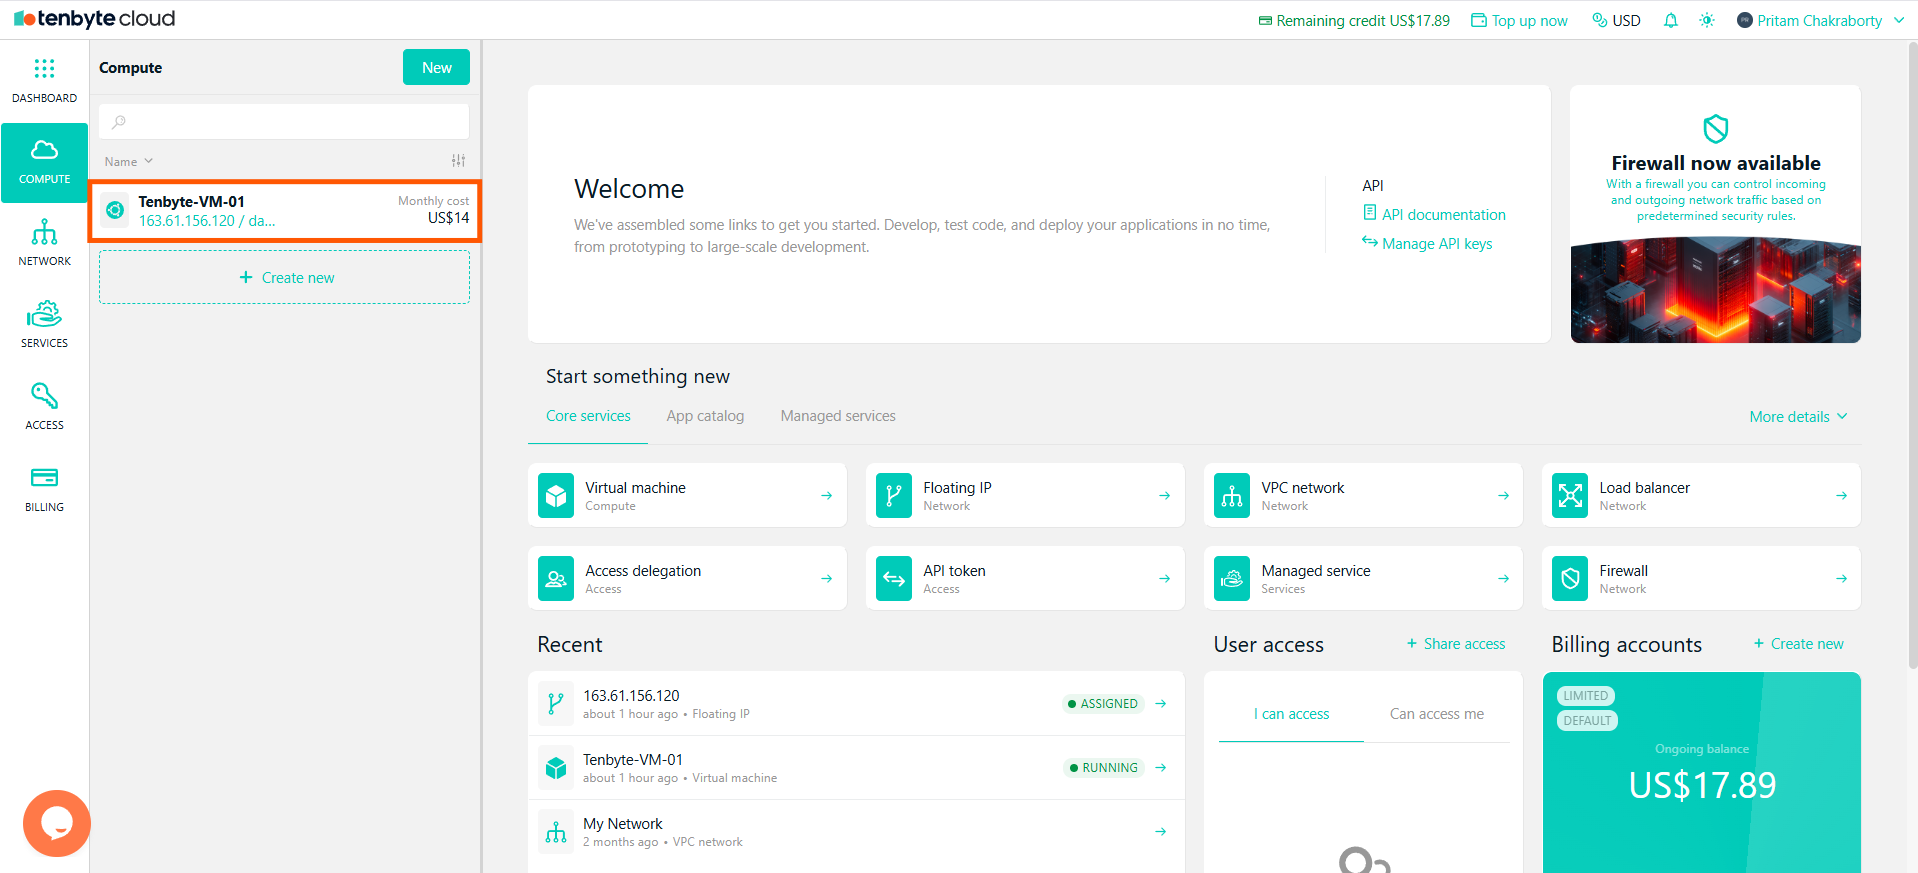
* From the **Tenbyte Cloud dashboard**, select the **virtual machine (VM)** you want to monitor.
 * Once your VM is selected, go to the **Metrics** tab.
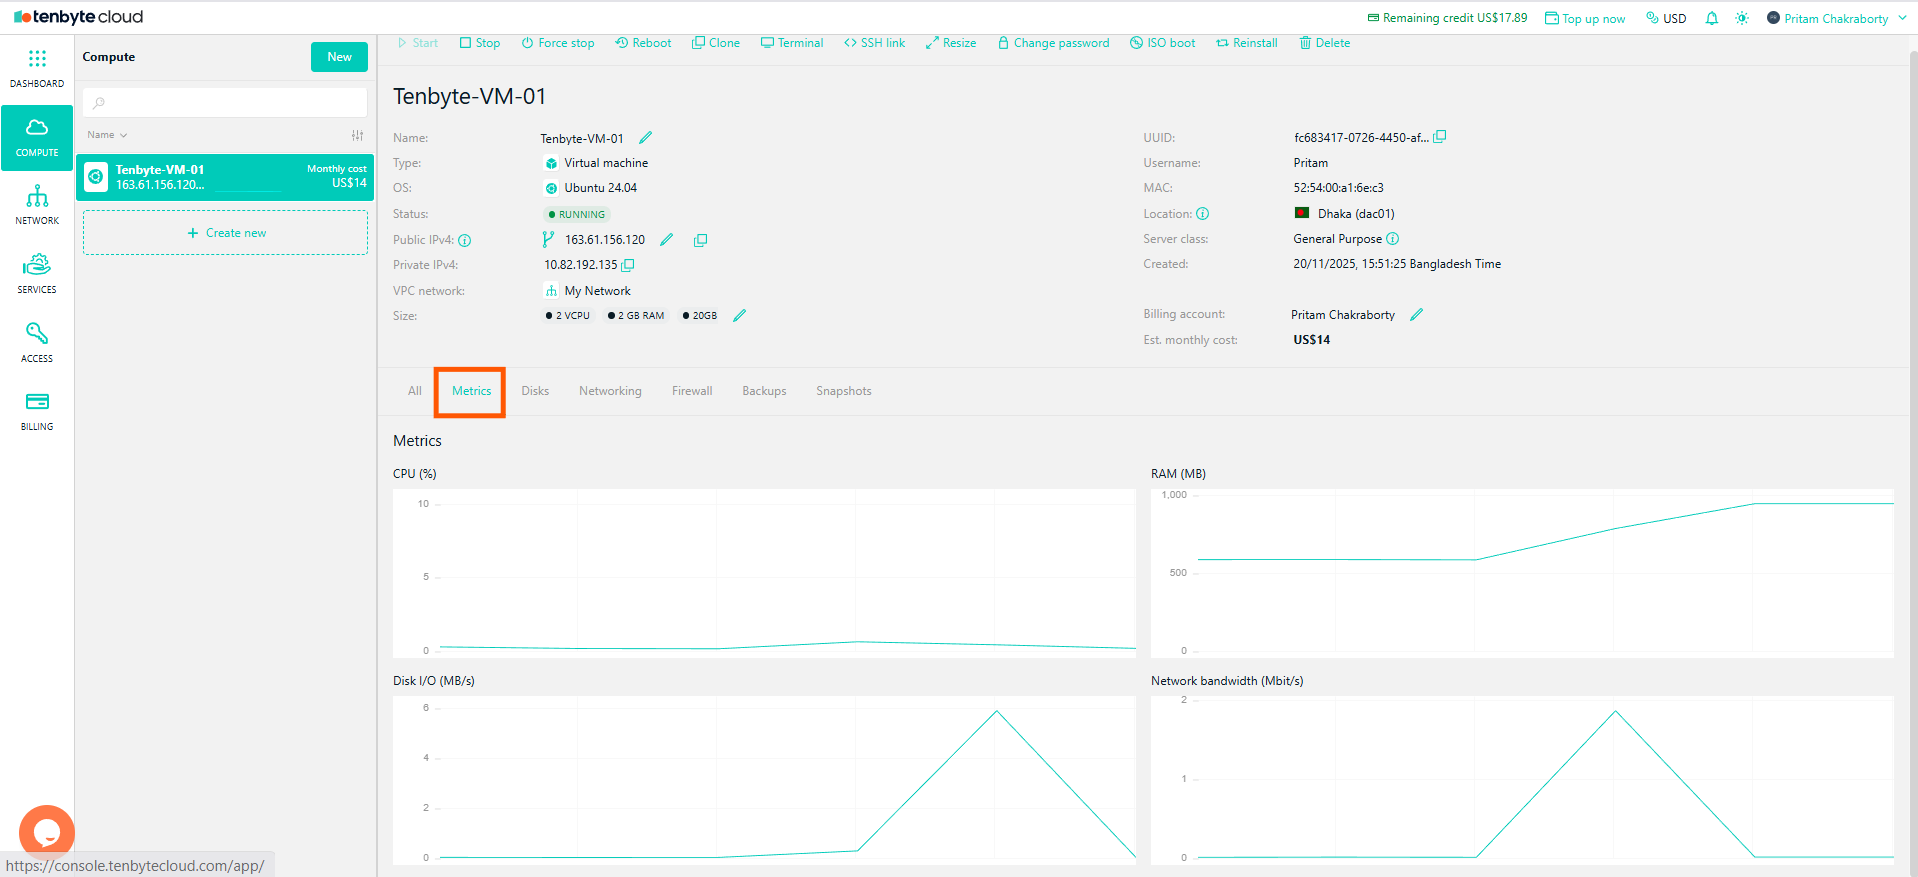 * In the **Metrics tab**, you will see **4 graphs** displaying key performance data for your VM:
1. **CPU Usage**
2. **RAM Usage**
3. **Disk I/O**
4. **Network Bandwidth**
### CPU Metrics
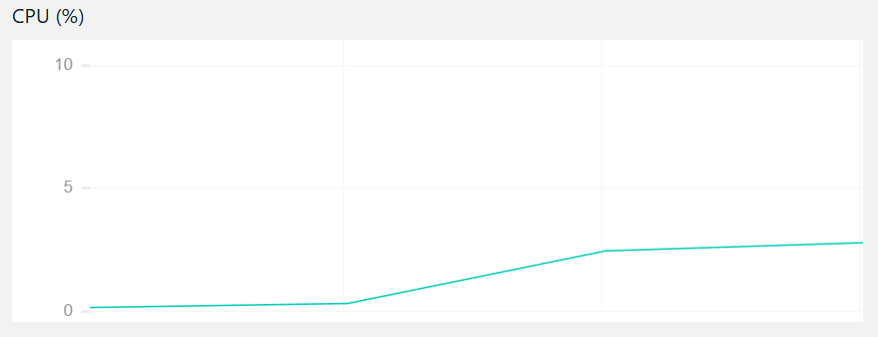
* The **CPU** (%) graph shows the **percentage of CPU usage** over time.
* It helps you **keep track of the CPU Resources** used by your virtual machine.
* If the CPU usage is higher, it can mean your VM is processing more data, running more tasks, or handling more traffic.
* In the **Metrics tab**, you will see **4 graphs** displaying key performance data for your VM:
1. **CPU Usage**
2. **RAM Usage**
3. **Disk I/O**
4. **Network Bandwidth**
### CPU Metrics
* The **CPU** (%) graph shows the **percentage of CPU usage** over time.
* It helps you **keep track of the CPU Resources** used by your virtual machine.
* If the CPU usage is higher, it can mean your VM is processing more data, running more tasks, or handling more traffic.
 ### RAM Metrics
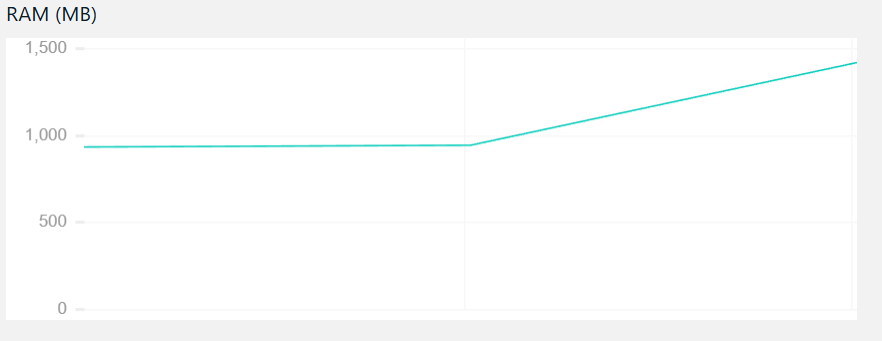
* The **RAM (MB)** graph displays the **memory usage** of your VM.
* It **indicates the total RAM storage**. Then the part of RAM that is being utilized.
### RAM Metrics
* The **RAM (MB)** graph displays the **memory usage** of your VM.
* It **indicates the total RAM storage**. Then the part of RAM that is being utilized.
 ### Disk I/O Metrics
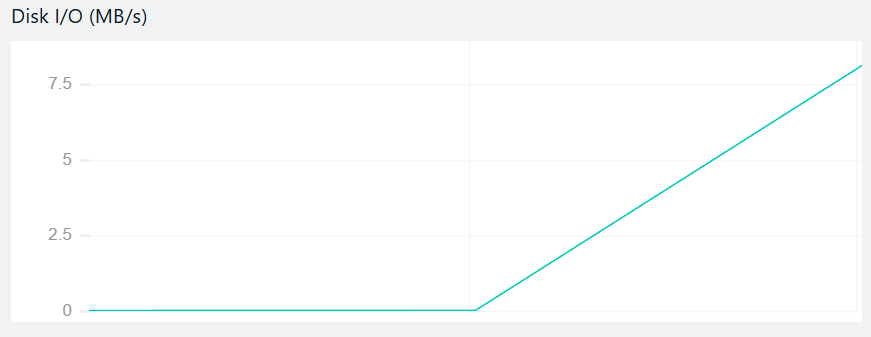
* The **Disk I/O (MB/s)** graph shows your **VM’s disk read** and **write operations**.
* It indicates how much data is sent to or received from the disk in seconds.
### Disk I/O Metrics
* The **Disk I/O (MB/s)** graph shows your **VM’s disk read** and **write operations**.
* It indicates how much data is sent to or received from the disk in seconds.
 ### Network Bandwidth Metrics
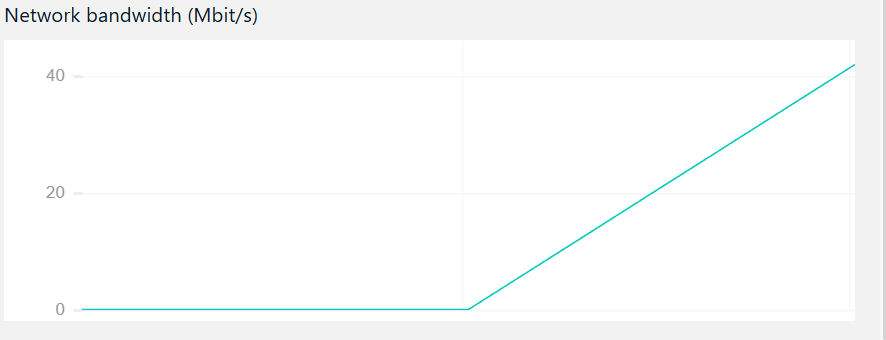
* The graph displays the **quantity of data** your **VM is transferring** **over the network in Mbit/s**.
* This will help you monitor incoming and outgoing traffic.
### Network Bandwidth Metrics
* The graph displays the **quantity of data** your **VM is transferring** **over the network in Mbit/s**.
* This will help you monitor incoming and outgoing traffic.