> ## Documentation Index
> Fetch the complete documentation index at: https://docs.tenbyte.io/llms.txt
> Use this file to discover all available pages before exploring further.
# Requests Served
> Track the number of HTTP requests the CDN handled. Spot traffic patterns, abuse, and bot activity.
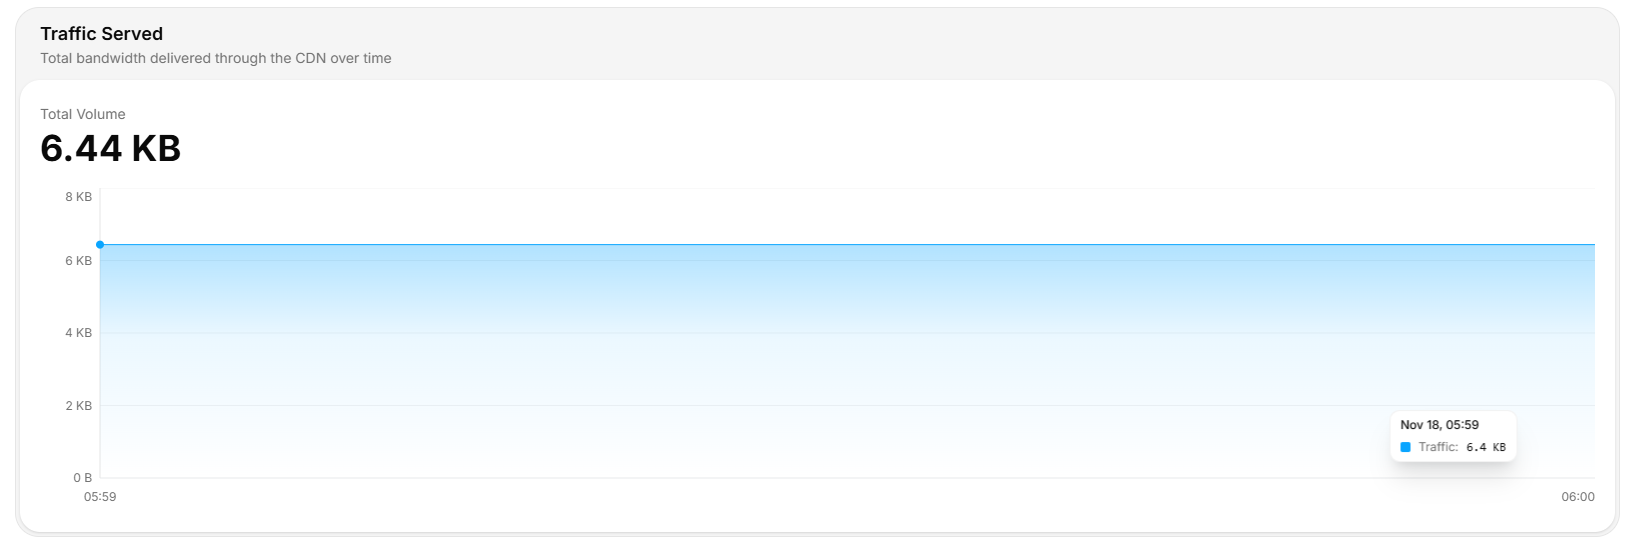
Requests Served counts every HTTP request the CDN processed — cache hits, cache misses, errors, and OPTIONS preflights all included.
 ## What it tells you
* Total request volume in the selected window.
* How that compares to the previous period.
* Hourly / daily distribution — peaks, troughs, anomalies.
## How to read the chart
| Element | Meaning |
| ----------- | ------------------------------------ |
| Main number | Total requests (M / B suffix). |
| Percentage | Delta vs the prior identical window. |
| Sparkline | Time-series — find spikes and dips. |
## Pull via API
```bash theme={null}
curl -sS "https://api.tenbyte.io/cdn/distributions/$DISTRIBUTION_ID/analytics/requests?from=2026-05-01T00:00:00Z&to=2026-05-09T00:00:00Z&granularity=hour" \
-H "Authorization: Bearer $TENBYTE_API_TOKEN" | jq
```
Response (truncated):
```json theme={null}
{
"total_requests": 45012345,
"series": [
{"ts": "2026-05-01T00:00:00Z", "requests": 1923456},
{"ts": "2026-05-01T01:00:00Z", "requests": 1876543}
]
}
```
## Requests vs traffic
A high request count with low [traffic](/docs/cdn/analytics/traffic-reports) means tiny payloads (API JSON, manifests). A high traffic with low requests means big objects (video, downloads). Watch both ratios.
| Ratio | Workload |
| ---------------------------- | ---------------------------------------------------- |
| Many requests, low bytes/req | API-style or HLS manifest. |
| Few requests, high bytes/req | Video / downloads / large images. |
| Both high | Mixed-purpose distribution — scope per-path metrics. |
## Spot abuse
Sudden request spikes without a corresponding traffic spike usually mean:
* **Bot scraping** — same small object hit thousands of times.
* **Cache busting** — random query strings forcing every request to be unique.
* **Probing** — `404` flood from a vulnerability scanner.
Drill into [response classes](/docs/cdn/analytics/response-classes) and consider an IP or country [access rule](/docs/cdn/distributions/access-rules/overview).
## Operational tips
* **Group by path.** The top 10 paths by request count usually drive the bulk of origin traffic.
* **Watch off-hours.** Sustained traffic at 03:00 local is rarely human.
* **Combine with cache-hit ratio.** High request count + low HIT% = origin pain. Tune cache rules.
* **Alert on rate change**, not raw totals — easier to write portable thresholds.
## What it tells you
* Total request volume in the selected window.
* How that compares to the previous period.
* Hourly / daily distribution — peaks, troughs, anomalies.
## How to read the chart
| Element | Meaning |
| ----------- | ------------------------------------ |
| Main number | Total requests (M / B suffix). |
| Percentage | Delta vs the prior identical window. |
| Sparkline | Time-series — find spikes and dips. |
## Pull via API
```bash theme={null}
curl -sS "https://api.tenbyte.io/cdn/distributions/$DISTRIBUTION_ID/analytics/requests?from=2026-05-01T00:00:00Z&to=2026-05-09T00:00:00Z&granularity=hour" \
-H "Authorization: Bearer $TENBYTE_API_TOKEN" | jq
```
Response (truncated):
```json theme={null}
{
"total_requests": 45012345,
"series": [
{"ts": "2026-05-01T00:00:00Z", "requests": 1923456},
{"ts": "2026-05-01T01:00:00Z", "requests": 1876543}
]
}
```
## Requests vs traffic
A high request count with low [traffic](/docs/cdn/analytics/traffic-reports) means tiny payloads (API JSON, manifests). A high traffic with low requests means big objects (video, downloads). Watch both ratios.
| Ratio | Workload |
| ---------------------------- | ---------------------------------------------------- |
| Many requests, low bytes/req | API-style or HLS manifest. |
| Few requests, high bytes/req | Video / downloads / large images. |
| Both high | Mixed-purpose distribution — scope per-path metrics. |
## Spot abuse
Sudden request spikes without a corresponding traffic spike usually mean:
* **Bot scraping** — same small object hit thousands of times.
* **Cache busting** — random query strings forcing every request to be unique.
* **Probing** — `404` flood from a vulnerability scanner.
Drill into [response classes](/docs/cdn/analytics/response-classes) and consider an IP or country [access rule](/docs/cdn/distributions/access-rules/overview).
## Operational tips
* **Group by path.** The top 10 paths by request count usually drive the bulk of origin traffic.
* **Watch off-hours.** Sustained traffic at 03:00 local is rarely human.
* **Combine with cache-hit ratio.** High request count + low HIT% = origin pain. Tune cache rules.
* **Alert on rate change**, not raw totals — easier to write portable thresholds.