> ## Documentation Index
> Fetch the complete documentation index at: https://docs.tenbyte.io/llms.txt
> Use this file to discover all available pages before exploring further.
# Cache Hit Ratio
> Measure cache efficiency — the headline metric for CDN performance and origin cost. Includes diagnosis and tuning playbook.
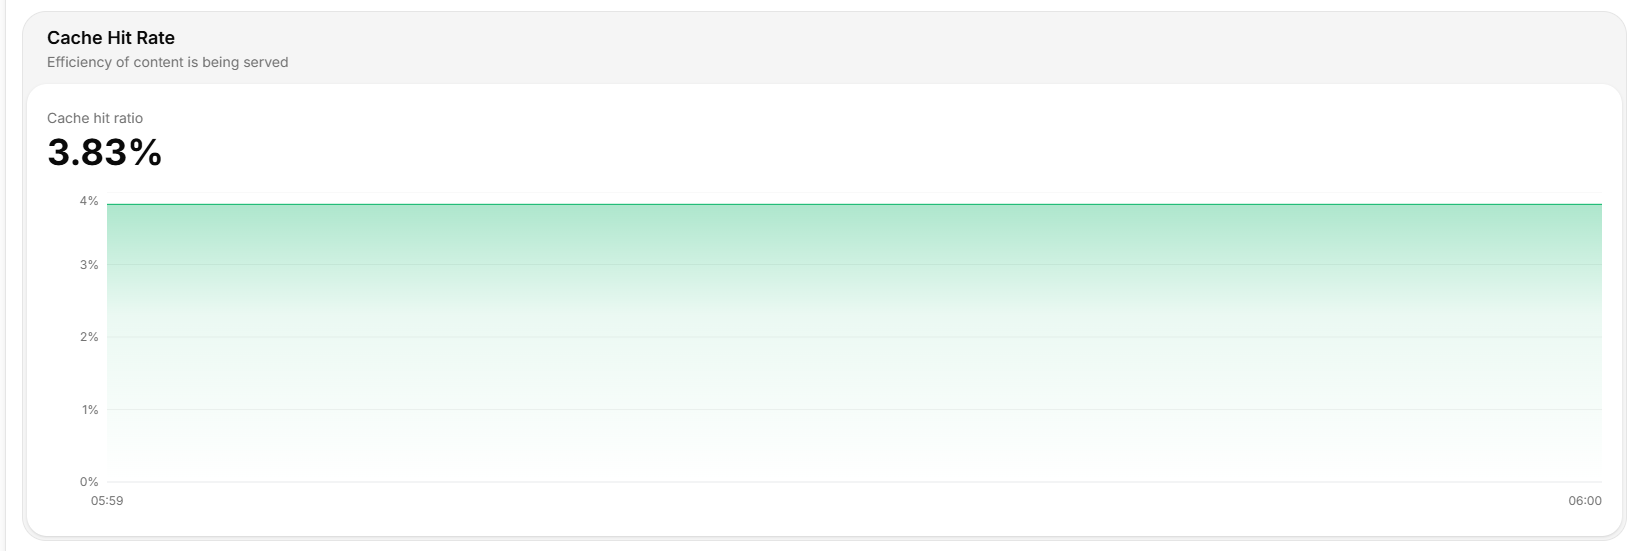
Cache hit ratio (CHR) is the single most important CDN metric. It's the share of requests served straight from the edge cache, with no origin round-trip. High CHR means lower latency, lower origin load, and a smaller bill.
 ## How it's calculated
```
cache_hit_ratio = cache_hits / (cache_hits + cache_misses)
```
A `MISS` becomes a `HIT` after the first request fills the cache. A path that's only ever requested once is always a `MISS` and drags CHR down — that's normal for long-tail content.
## What "good" looks like
| Workload | Healthy CHR | Investigate |
| --------------------------- | ----------- | --------------- |
| Static assets (`/static/*`) | 95–99% | \< 90% |
| Image library | 90–98% | \< 85% |
| HLS / DASH VOD | 90–97% | \< 85% |
| Mixed (HTML + API + assets) | 75–90% | \< 65% |
| API-heavy (short TTL) | 30–70% | wildly variable |
Don't chase a single number — chase trend stability per path class.
## Read the chart
| Element | Meaning |
| ------------ | ------------------------------------------------------------------- |
| Main % | Hit ratio over the window. |
| Trend line | Rolling CHR — sudden drops point at deploys, purges, or noisy keys. |
| Comparison % | Change vs prior period. |
## Pull via API
```bash theme={null}
curl -sS "https://api.tenbyte.io/cdn/distributions/$DISTRIBUTION_ID/analytics/cache?from=2026-05-01T00:00:00Z&to=2026-05-09T00:00:00Z" \
-H "Authorization: Bearer $TENBYTE_API_TOKEN" | jq
```
```json theme={null}
{
"hits": 41510234,
"misses": 3501112,
"hit_ratio": 0.922,
"series": [
{"ts": "2026-05-01T00:00:00Z", "hit_ratio": 0.94}
]
}
```
## Diagnose a low CHR
```mermaid theme={null}
flowchart TD
LOW[Low CHR] --> Q1{Origin sends
## How it's calculated
```
cache_hit_ratio = cache_hits / (cache_hits + cache_misses)
```
A `MISS` becomes a `HIT` after the first request fills the cache. A path that's only ever requested once is always a `MISS` and drags CHR down — that's normal for long-tail content.
## What "good" looks like
| Workload | Healthy CHR | Investigate |
| --------------------------- | ----------- | --------------- |
| Static assets (`/static/*`) | 95–99% | \< 90% |
| Image library | 90–98% | \< 85% |
| HLS / DASH VOD | 90–97% | \< 85% |
| Mixed (HTML + API + assets) | 75–90% | \< 65% |
| API-heavy (short TTL) | 30–70% | wildly variable |
Don't chase a single number — chase trend stability per path class.
## Read the chart
| Element | Meaning |
| ------------ | ------------------------------------------------------------------- |
| Main % | Hit ratio over the window. |
| Trend line | Rolling CHR — sudden drops point at deploys, purges, or noisy keys. |
| Comparison % | Change vs prior period. |
## Pull via API
```bash theme={null}
curl -sS "https://api.tenbyte.io/cdn/distributions/$DISTRIBUTION_ID/analytics/cache?from=2026-05-01T00:00:00Z&to=2026-05-09T00:00:00Z" \
-H "Authorization: Bearer $TENBYTE_API_TOKEN" | jq
```
```json theme={null}
{
"hits": 41510234,
"misses": 3501112,
"hit_ratio": 0.922,
"series": [
{"ts": "2026-05-01T00:00:00Z", "hit_ratio": 0.94}
]
}
```
## Diagnose a low CHR
```mermaid theme={null}
flowchart TD
LOW[Low CHR] --> Q1{Origin sends
Cache-Control: private?}
Q1 -- yes --> R1[Override via cache rule:
Ignore Origin No Cache]
Q1 -- no --> Q2{Query string varies
per request?}
Q2 -- yes --> R2[Enable Ignore Query
String in Cache Key]
Q2 -- no --> Q3{Vary header
fragmenting cache?}
Q3 -- yes --> R3[Strip / narrow Vary
via response header rule]
Q3 -- no --> Q4{TTL too short?}
Q4 -- yes --> R4[Bump expiration on
cache rule]
Q4 -- no --> Q5[Long-tail content
requested once]
Q5 --> R5[Likely fine — accept]
```
## Tuning playbook
1. **Spot the bad prefix.** Filter analytics by URL prefix; find the prefix dragging overall CHR down.
2. **Inspect a sample path.** `curl -sSI "$CDN_HOST/the/path"` and look at `cache-control`, `vary`, and the cache rule that matches.
3. **Apply the right fix:**
* Origin sends `private` / `no-store` → enable **Ignore Origin No Cache** on the [cache rule](/docs/cdn/distributions/cache-rules).
* Query string is noisy → enable **Ignore Query String in Cache Key**.
* `Vary: User-Agent` fragments cache → strip or narrow via [response header rule](/docs/cdn/distributions/headers).
* TTL too short → bump expiration time.
4. **Validate.** Wait for the cache to rewarm, then check CHR per path.
## Common false alarms
* **CHR drops right after a [purge](/docs/cdn/purge/purge-by-pattern).** Expected — every purged path becomes a MISS until refilled. Watch for recovery within minutes.
* **CHR drops on launch day.** New paths haven't filled the cache yet. Don't tune; wait.
* **Low CHR on auth callbacks / per-user JSON.** These are correctly uncacheable. Exclude them from your "should be cached" baseline.
## Operational tips
* **Track per-path-class CHR**, not a single distribution-wide number — averages hide problems.
* **Alert on slope, not value.** A 10-point drop in 5 minutes is incident-worthy; a slowly drifting baseline calls for tuning, not paging.
* **Pair with origin metrics.** Origin CPU spikes that line up with CHR drops confirm causation.
* **Cache hit ratio + bandwidth** answers "is this CDN paying off?" — the higher CHR, the more leverage.